It’s been a while. I’ve been having too much fun hacking other things and too much pain studying for exams. But here’s something fun also: it’s about careers.
In a question on a labour economics assignment, we were asked to ponder on the present discounted value of our future careers. The question asks us to do some calculations, taking into consideration relocation, returns to On-the-Job training, and then write a short essay to explain the logic and assumptions behind the numbers.
I did the calculations for a business owner because that has always been my aspiration. It was not pleasant to find that self-employed incorporated individuals (a.k.a. business owners) earn way less in general compared to other professionals. Also, it seems economists are fond of associating self-employment as a way for noncompetitive workers to escape unemployment, immigrants to hide in immigrant economic enclaves, and for gender minorities to make a living while discouraged from job search.
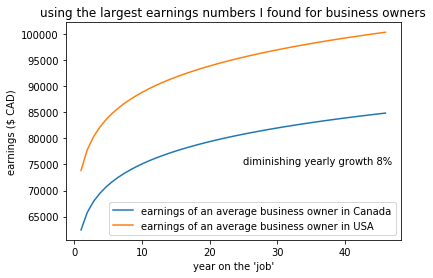
So among a few <30,000CAD earnings numbers found in my mini literature review, I cherrypicked the largest number. It is $62449.60 CAD for a median Canadian business owner (Grekou & Liu, 2018); and $73,852.92 CAD equivalent for a median American business owner (Levine & Rubinstein, 2017). So if we assume 8% yearly growth with diminishing returns:
 (these 2 locations are chosen and shown because of data availability.)
The future looks bleak. After 50 years on the job, an average (median) business owner doesn’t earn more than $85,000 per year (the American number is not adjusted for living cost.) That’s the typical salary for any mid-range experienced person, though with significantly less risks and work hours.
Something is off with these numbers. The average financial asset owned by business owners in Canada is almost 2 times that of the employed (LaRochelle-Côté & Uppal, 2011), but the average earnings numbers look wobbly against other professions.Obviously, the funny business of under-reporting earnings plays a role. Business owners usually enjoy significant consumption premia over their income premia, as reported in a 2014 research by Krichevskiy. In particular, he questioned some 0 income claims that surely made Krinchevsky a doubting Thomas. Though, if you are in the startup circle, you’d know how that looks like (did you know that Slack Tech Inc. has yet to report profit?)
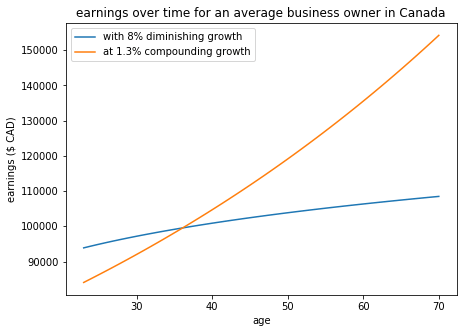
But I have a homework to submit. So after a bit of clever adjustment, I made my earnings growth compounding at 1.3% per annum.
Thus my present discounted value of a career as a business owner:
\[\sum_{t=0}^{n=5} \frac{c_t}{(1+r)^2} + \sum_{t=6}^{n=52} \bigg[ \frac { (1+\alpha)^{t-6} \big[ \pi w_{1} + (1-\pi)w_{2} \big] }{(1+r)^{t-6}} \bigg] - (1-\pi) m\]where \(c\) = cost of school, \(t\) = time, \(r\) = discount rate, π = probability of not changing working location, \(w_{i,t}\) = wage at time t, \(i\) = 1, \(1 + α\) = wage growth factor
Notice a claim of 1.3% compounding growth for a business owner starting out at base earnings. This »» \((1+\alpha)^{t-6}\) And then the graph looks a lot better indeed »»
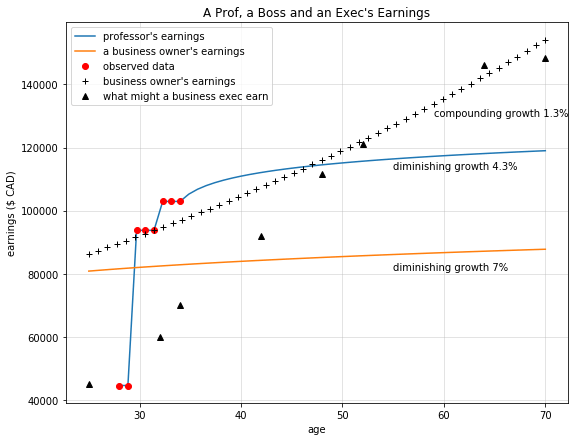
 Now I can compare that with a professor (or an economist), and a business executive, and see that business owner’s earnings rise above all others:

Assuming that wages are real (i.e. adjusted for inflation,) all these people on this graph are lucky fellows:
The professor finishes her PhD at age 28 and got a measly teaching job, then accepts a tenure-track teaching position which brings in a tenure placement at age 34. She is hyped by the advancement and works hard cranking out research until she turns 40, when her earlier days of 4 hours sleep debt catches up with her, so she slows down her pace. The professor/economist does not engage in industry projects or consultancy. (Wage data is from University of British Columbia because my school does not publish data for non-tenure academic staff – transparency ensured)
The business exec starts her career at age 26 with a postgrad degree in economics. She earned low wages at the start, but she progressed over the years to some of the highest positions. She refuses to let go of her position so she is somehow still the VP Operations at some big company past 65 years old. She retires at 70 years old and forgets to report her options cashings. (No sure how the corporate ladder works, so I just found some salary numbers off vacancies on Indeed.com at different ranks for positions in Edmonton)
The business owner decides to study for a Masters in economics for no reason. She starts building a business at age 26, already generating enough profit to pay herself a salary in her first year. Her business grows nicely and her earnings grows at 1.3% each year.
That is a nice looking graph. And also quite a large pile of rubbish.
See, even if these are best-fit lines through actual data points, which means that the actual data points feeding into the graph exhibit turbulence, this merely shows some best-case scenarios that might happen given choice of any of these careers. A business owner tries and fails, and an economist may very well stay in her PhD for as long as Queen Elizabeth II has the throne, and receives no job offers afterwards. Business executives also may have rocky careers.
In fact, looking at my problematic function construction (as you’ll see in my actual work submitted,) that’d be my story if I chose to become a professor / economist. I’d struggle to earn my doctorate, then wait for another 5 years to get into a university. I would never be secured enough to get married. I’d be so snappy, even my cat Moody and dog Bobby despise me. I would have only one friend, its name is Teddy. I’d die alone in a rented old apartment reeking of rotten garlic.
Whoa, that went quite far. Exam revision does that to you. I’ll publish this as a diary, but don’t take it seriously.
If you are curious, see my actual submitted work for this question here: ECON331-FA2018-ASGN2-Q2. Warning: It’s marred with inaccurate assumptions and incorrect notations! But feel free to email or leave a comment to discuss, anyway.
Written by Natasha. Last edited:2018-12-09 14:49:14
